import matplotlib
if not hasattr(matplotlib.RcParams, "_get"):
    matplotlib.RcParams._get = dict.get
3.2. Customizing the Plot#
matplotlib provides numerous options for customizing your plots. Let’s make some modifications to our previous plot.
import matplotlib.pyplot as plt
import numpy as np

plt.figure(figsize=(4,2))
plt.plot(x, y, linestyle='--', linewidth=5, color='r')
plt.xlim(2, 8)
plt.ylim(15, 25)
plt.xlabel('X-axis', fontsize=14, color='b')
plt.ylabel('Y-axis', fontsize=14, color='b')
plt.title('Customized plot', fontsize=18)
plt.grid(True)
plt.show()
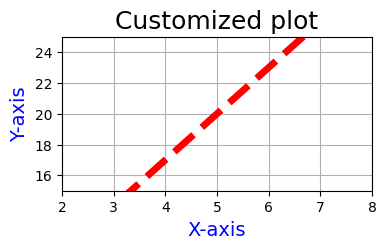
Let’s break it down
plt.figure(figsize=(4,2)): Creates a new plot with a width of 4 units and height of 2 units.plt.plot(x, y, linestyle='--', linewidth=5, color='r'): Plots the x and y values with a dashed line style, a line width of 5 units, and a red color.plt.xlim(2, 8): Sets the x-axis limits to range from 2 to 8.plt.ylim(10, 30): Sets the y-axis limits to range from 15 to 25.plt.xlabel('X-axis', fontsize=14, color='b'): Adds a blue x-axis label with a font size of 14 units.plt.ylabel('Y-axis', fontsize=14, color='b'): Adds a blue y-axis label with a font size of 14 units.plt.title('Customized plot', fontsize=18): Sets the plot’s title to ‘Customized plot’ with a font size of 18 units.plt.grid(True): Adds a grid to the plot.plt.show(): Displays the plot on the screen.